Quick Answer: Is Stanford University Expensive?
Stanford University reports tuition of $62,484 (out-of-state) / $62,484 (in-state) and an average net price of $12,136. Net price is usually more useful than tuition because it reflects grants and scholarships where reported.
Stanford University is a private nonprofit in Stanford, CA. The total estimated cost of attendance is $82,162, the acceptance rate is 3.91%, and median earnings 10 years after enrollment are $124,080.
Use these numbers for comparison only. Confirm current tuition, aid, deadlines and program requirements on Stanford University’s official website before applying.
Need the cost-focused view? View Stanford University tuition fees and ROI details .
Verify before applying
Official links and next steps
Federal data supports comparisons, but the university sets current tuition, aid policies and application requirements. Use these official resources before you submit an application or accept an aid offer.
Shortlist check
Could Stanford University fit your shortlist?
Stanford University is a private nonprofit in Stanford, CA. Its reported average net price is $12,136, compared with published out-of-state tuition of $62,484. Use your actual aid estimate to decide whether the cost is manageable.
Keep it on your list if
- You want to compare a private nonprofit option in Stanford with nearby alternatives.
- Your official net price estimate is affordable after grants, scholarships and living costs.
- You are comfortable comparing the reported 92.82% completion rate and $124,080 10-year earnings with similar schools.
Compare other options first if
- Your net price calculator result is above your budget or requires borrowing you have not reviewed.
- You need a specific program, scholarship or deadline that is not confirmed in the official university materials.
- You have not compared California schools by net price, aid and outcomes.
Financial fit check
When This School May Not Be the Right Financial Fit
A college is only a good investment if it matches your family's budget. Stanford University may not be the right choice if:
- Your official net price calculator result is much higher than your family budget.
- You would need large private loans without comparing lower-cost options.
- Your intended program has extra fees not reflected in general tuition data.
Table of Contents
Decision guide
Start with cost, then test the fit
A useful comparison starts with tuition and average net price, then adds admission difficulty, aid, programs and outcomes. The figures below use imported federal fields when reported. This page leaves unavailable requirements and deadlines for official verification instead of filling gaps with estimates.
Tuition fees
$62,484
Net price
$12,136
Acceptance rate
3.91%
SAT
1,553
ACT
34-35
Graduation rate
92.82%
Salary after graduation
$124,080
ROI payback
0.4 yrs
Reported snapshot
Stanford University at a glance
Use this snapshot for an initial screen of cost, admissions and student outcomes. If a value matters to your decision, follow the official resource links above before applying or committing to attendance.
Enrollment
7,841
Undergraduate students reported
Graduate students
10,392
Graduate enrollment where reported
Student faculty ratio
6:1
Classroom access signal
Retention rate
97.81%
Full-time first-year retention
| Profile field | Reported value |
|---|---|
| Institution type | Private nonprofit |
| Accreditor | Western Association of Schools and Colleges Senior Colleges and University Commission |
| Admissions policy | Selective admissions policy reported |
| Main campus | Main campus reported |
| Online only | Campus or mixed delivery |
| Address | Stanford, CA 94305 |
Admissions
Is Stanford University hard to get into?
Acceptance rate is 3.91%. Reported SAT and ACT fields help you compare applicant context where available. The imported dataset does not establish current GPA requirements, essays or deadlines, so confirm those items with the official university before applying.
Acceptance rate
3.91%
SAT overall
1,553
ACT range
34-35
GPA requirement
Verify official source
How to use these admissions signals
Acceptance rate shows selectivity, SAT and ACT data show admitted-student testing context, and the official admissions page should confirm current application deadline, GPA requirements, essays, recommendations, test-optional rules and transfer requirements.
Application checklist
- Confirm application deadline and priority scholarship deadline.
- Review SAT requirements, ACT requirements and test-optional policy.
- Check GPA requirements and transcript requirements.
- Compare net price and financial aid before submitting.
Interactive cost planning
What you may pay after aid
Sticker price tells only part of the story. Compare reported tuition with attendance cost and net price by income where the data is available, then use the official net price calculator for a personal estimate.
Tuition
$62,484
Room and board
$19,922
Books and supplies
$825
Other expenses
$4,602
Net price
$12,136
4-year net price
$48,544
Stanford University Net Price by Income Bracket
| Family income | Avg net price | Savings vs sticker | Monthly view | Estimator |
|---|---|---|---|---|
| $0–$30,000 | $0 | $82,241 | $-7/mo | |
| $30,001–$48,000 | $0 | $82,512 | $-29/mo | |
| $48,001–$75,000 | $1,323 | $80,839 | $110/mo | |
| $75,001–$110,000 | $8,816 | $73,346 | $735/mo | |
| Over $110,000 | $50,452 | $31,710 | $4,204/mo |
Estimated net price for :
Actual costs can vary by residency, housing, aid eligibility, program, scholarships and billing rules. Use Stanford University's official net price calculator for a personalized estimate.
Financial aid and borrowing
How aid and loans affect the price
Financial aid research should separate grants and scholarships from loans. This block summarizes Pell Grant rate, federal loan rate, students with any loan, median completer debt, monthly payment and repayment counts so families can compare affordability beyond tuition fees.
Pell Grant rate
19.23%
Federal loan rate
6.29%
Students with any loan
44.98%
Median completer debt
$12,000
Median monthly payment
$127
Loan principal
$9,851
| Repayment field | Reported value |
|---|---|
| 1-year repayment count | 616 |
| 3-year repayment count | 625 |
| 5-year repayment count | 711 |
| 7-year repayment count | 697 |
| 3-year default rate | 0.00% |
Outcomes and ROI
What to check after cost
This dashboard combines graduation rate, salary after graduation, transfer outcome, repayment data and a simple ROI payback estimate. It gives readers a stronger college value picture than tuition or net price alone.
Graduation rate 4-year
58.12%
Normal time
Graduation rate 150%
92.82%
Federal 150% completion
Transfer rate
0.59%
Full-time transfer outcome
10-year earnings
$124,080
Median after entry
ROI disclaimer: ROI payback is a simple directional comparison using average net price and reported earnings. It is not a loan repayment estimate, salary guarantee, or financial advice.
| Earnings and ROI field | Reported value |
|---|---|
| 6 years after entry | $102,887 |
| 10-year median earnings | $124,080 |
| 10-year mean earnings | $141,300 |
| Simple ROI payback | 0.4 years |
Student body
Campus community context
Student body context helps readers understand the campus community before comparing tuition fees, admissions requirements, majors and ROI. Values below use the imported federal student profile fields where reported.
Racial and ethnic diversity
Gender and economic profile
First-generation share
30.34%
Low-income share
34.21%
Average family income
$836
Pell students
1
Programs and earnings
Programs with reported salary signals
Review the reported program mix and available earnings fields before choosing a major. Salary values describe published outcomes in the federal source; they are not salary promises for individual graduates.
Popular areas of study
| Major / program | Credential | Awards | Program salary |
|---|---|---|---|
| Management Sciences and Quantitative Methods | Master's Degree | 460 | Not reported |
| Computer Science | Master's Degree | 332 | $159,729 |
| Computer Science | Bachelor's Degree | 307 | $136,126 |
| Law | First Professional Degree | 184 | $151,574 |
| Civil Engineering | Master's Degree | 177 | $78,911 |
| Mechanical Engineering | Master's Degree | 163 | $105,326 |
| Electrical, Electronics and Communications Engineering | Master's Degree | 155 | $128,556 |
| Human Biology | Bachelor's Degree | 142 | $40,010 |
| Engineering-Related Fields | Master's Degree | 130 | $123,354 |
| Cognitive Science | Bachelor's Degree | 106 | $105,695 |
| Engineering, Other | Bachelor's Degree | 105 | $55,933 |
| Medicine | First Professional Degree | 104 | $68,238 |
| Economics | Bachelor's Degree | 90 | $60,475 |
| Electrical, Electronics and Communications Engineering | Doctoral Degree | 84 | $137,457 |
| Legal Research and Advanced Professional Studies | Master's Degree | 82 | Not reported |
| Education, General | Master's Degree | 81 | $64,331 |
| Engineering-Related Fields | Bachelor's Degree | 76 | $77,180 |
| Aerospace, Aeronautical and Astronautical Engineering | Master's Degree | 67 | $108,457 |
Highest reported program salary signals
Computer Science
Master's Degree
$159,729
Law
First Professional Degree
$151,574
Electrical, Electronics and Communications Engineering
Doctoral Degree
$137,457
Computer Science
Bachelor's Degree
$136,126
Electrical, Electronics and Communications Engineering
Master's Degree
$128,556
Engineering-Related Fields
Master's Degree
$123,354
Aerospace, Aeronautical and Astronautical Engineering
Master's Degree
$108,457
Cognitive Science
Bachelor's Degree
$105,695
Mechanical Engineering
Master's Degree
$105,326
Civil Engineering
Master's Degree
$78,911
Engineering-Related Fields
Bachelor's Degree
$77,180
Medicine
First Professional Degree
$68,238
Published tuition and cost components
Stanford University tuition fees are reported here per College Scorecard/IPEDS cost fields. Separate mandatory fee data is not available for every school, so tuition, room and board, books, other expenses, attendance cost and net price are shown as the supported cost components.
| Cost field | Reported value |
|---|---|
| Tuition fees | $62,484 |
| In-state tuition | $62,484 |
| Out-of-state tuition | $62,484 |
| Cost per year | $82,162 |
| Average net price | $12,136 |
| Estimated 4-year attendance cost | $328,648 |
| Estimated 4-year net price | $48,544 |
Stanford University In-State Tuition
Stanford University in-state tuition per College Scorecard is $62,484. Stanford University is listed as Private nonprofit. If residency, program level, online status or campus location can change billing, verify the final in-state rate with the official tuition office.
Stanford University Out-of-State Tuition
Stanford University out-of-state tuition per College Scorecard is $62,484. The reported in-state and out-of-state tuition values match in the federal source fields used for this guide.
Stanford University Cost Per Year - 4-Year Total
Stanford University cost per year is best reviewed through attendance cost and average net price. The reported annual attendance cost is $82,162, while the average net price after aid is $12,136.
Cost per year
$82,162
4-year attendance estimate
$328,648
4-year net price estimate
$48,544
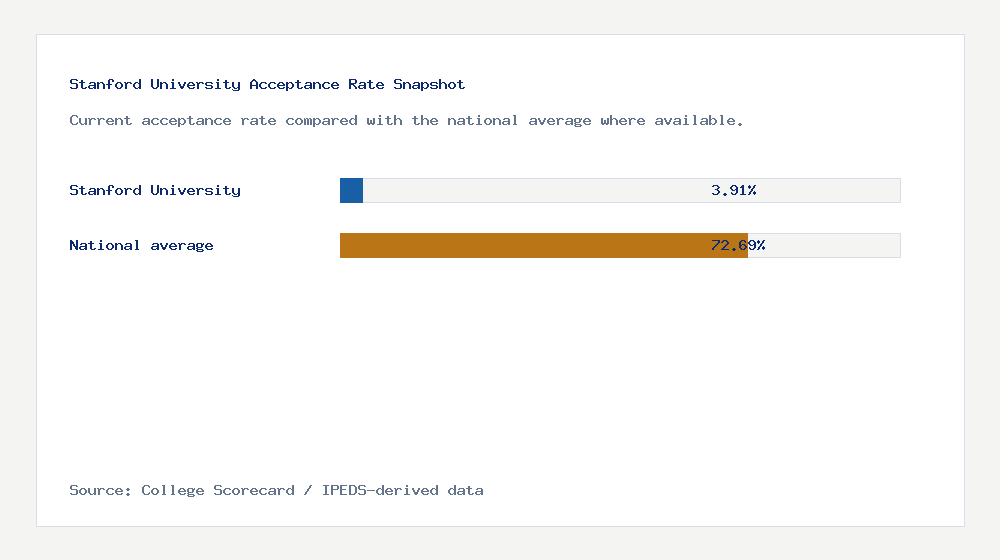
Stanford University Acceptance Rate 2026
Acceptance rate is 3.91%. Acceptance rate should be read with test scores, high school preparation, application strength and program competitiveness, not as a guarantee of admission.
| Admissions field | Reported value |
|---|---|
| Acceptance rate | 3.91% |
| SAT average/range | 1,553 |
| SAT Math middle range | 770-800 |
| SAT Reading middle range | 740-780 |
| ACT middle range | 34-35 |
| Admissions policy | Selective admissions policy reported |
| GPA requirements | Verify with official admissions |
| Application deadline | Verify with official admissions |
Stanford University SAT Requirements
SAT requirements for Stanford University are represented by reported SAT data when the school provides it to the federal dataset. Overall SAT is 1,553, SAT Math range is 770-800, and SAT Reading range is 740-780.
Stanford University ACT Requirements
ACT requirements for Stanford University should be verified with the current admissions office because test policies can change. The reported ACT middle range per College Scorecard is 34-35.
Stanford University GPA Requirements
GPA requirements are not reported in the College Scorecard and IPEDS data. Use the acceptance rate, SAT/ACT ranges and admissions policy here as context, then verify GPA expectations with the official admissions office.
Stanford University Admissions Requirements
Use the reported acceptance rate, SAT, ACT and admissions policy as the data-backed starting point for Stanford University admissions requirements. Students should still confirm transcripts, essays, recommendations, fee waivers, test-optional rules and program-specific requirements with the official admissions page.
Stanford University Application Deadline 2026
Application deadline data is not reported in the College Scorecard/IPEDS fields used here. Check the official admissions site for Early Action, Regular Decision, priority scholarship and transfer deadline dates.
Check Official Admissions DeadlinesHow to Apply to Stanford University Step-by-Step
-
1. Open the official admissions page
Start at Stanford University's official website so deadlines, application platform links and program-specific requirements are current.
Open resource -
2. Review admissions requirements
Check whether transcripts, essays, recommendations, SAT/ACT scores, GPA details, portfolio materials or transfer documents apply to your applicant type.
-
3. Estimate cost before applying
Compare tuition, net price, scholarships and financial aid, then use the net price calculator if Stanford University provides one.
Open resource -
4. Submit the application and aid forms
Submit the application before the official deadline and complete FAFSA or other aid forms when eligible.
Open resource
Stanford University Financial Aid
Stanford University financial aid context includes average net price, Pell Grant rate, federal loan rate and income-bracket net price where reported. Pell Grant rate is 19.23% and federal loan rate is 6.29%.
Stanford University Scholarships
Scholarship-level award names are not imported in the College Scorecard and IPEDS data. Use average net price, Pell Grant rate and loan rate here to understand aid signals, then verify merit scholarships, need-based grants, deadlines and renewal rules directly with Stanford University.
Stanford University Net Price by Family Income
Stanford University net price is $12,136 per College Scorecard. Net price is often more useful than tuition alone because it reflects average cost after grants and scholarships where reported.
Stanford University Rankings 2026
Stanford University ranking data from commercial ranking publishers is not included in the federal source fields used here. This page uses measurable ranking signals: tuition, net price, acceptance rate, graduation rate, salary after graduation and program outcomes.
| Outcome field | Reported value |
|---|---|
| Graduation rate | 92.82% |
| Salary after graduation | $124,080 |
| 10-year median earnings | $124,080 |
| State average net price | $19,695 |
| National average net price | $17,506 |
| ROI estimate | 0.4 years simple payback |
Stanford University Most Popular Majors
Major data comes from reported College Scorecard program records where available. Stanford University has 183 program records per College Scorecard.
Program
Management Sciences and Quantitative Methods
Master's Degree
460 reported awards
Program
Computer Science
Master's Degree
332 reported awards
Program
Computer Science
Bachelor's Degree
307 reported awards
Program
Law
First Professional Degree
184 reported awards
Program
Civil Engineering
Master's Degree
177 reported awards
Program
Mechanical Engineering
Master's Degree
163 reported awards
Program
Electrical, Electronics and Communications Engineering
Master's Degree
155 reported awards
Program
Human Biology
Bachelor's Degree
142 reported awards
Stanford University Best Programs & Schools
Best programs are ranked here by available program earnings first and reported awards second. This keeps the page data-backed without inventing third-party rankings.
Business Administration, Management and Operations
Master's Degree
Program earnings: $164,734
Computer Science
Master's Degree
Program earnings: $159,729
Electrical, Electronics and Communications Engineering
Bachelor's Degree
Program earnings: $154,251
Law
First Professional Degree
Program earnings: $151,574
Allied Health and Medical Assisting Services
Master's Degree
Program earnings: $147,202
Mechanical Engineering
Doctoral Degree
Program earnings: $143,758
Electrical, Electronics and Communications Engineering
Doctoral Degree
Program earnings: $137,457
Computer Science
Bachelor's Degree
Program earnings: $136,126
Stanford University Graduation Rate
Stanford University graduation rate per College Scorecard is 92.82%. This reflects students completing within 150% of normal time where the federal dataset reports the field.
Stanford University Salary After Graduation
Stanford University salary after graduation is represented by 10-year median earnings where reported. Per College Scorecard, $124,080 for 10-year median earnings.
Stanford University ROI - Return on Investment
Based on average net price and 10-year median earnings, Stanford University reaches a simple payback estimate in about 0.4 years. This is a directional ROI signal, not a personal financial forecast.
ROI disclaimer: ROI payback is a simple directional comparison using average net price and reported earnings. It is not a loan repayment estimate, salary guarantee, or financial advice.
ROI depends on personal aid, borrowing, major, graduation timing and career path. Use this as a dataset-based starting point, then compare official aid offers and program outcomes.
Stanford University Tuition Snapshot
Use these cost cards as the first-pass money view before checking the detailed breakdown and official resources.
In-state tuition
$62,484
Out-of-state tuition
$62,484
Average net price
$12,136
Attendance cost
$82,162
Stanford University Estimated Per-Semester Cost
Many tuition guides break annual costs into fall and spring estimates. The values below divide reported annual College Scorecard cost fields by two, so use them as planning estimates and verify the actual billing schedule with Stanford University.
Tuition
Per semester: $31,242
Annual: $62,484
Room and board
Per semester: $9,961
Annual: $19,922
Books and supplies
Per semester: $413
Annual: $825
Other on-campus expenses
Per semester: $2,301
Annual: $4,602
Attendance cost
Per semester: $41,081
Annual: $82,162
Stanford University Estimated Four-Year Cost
The estimates below multiply current reported annual values by four. They do not include future tuition increases, changes in housing, program fees, financial aid changes or personal expenses.
Four-year tuition estimate
$249,936
Four-year attendance estimate
$328,648
Four-year average net price
$48,544
In-State vs Out-of-State Tuition
Stanford University is listed as Private nonprofit per College Scorecard. In-state tuition is $62,484 and out-of-state tuition is $62,484. The reported in-state and out-of-state tuition values match in this dataset.
International Student and Private College Tuition Note
The College Scorecard lists Stanford University as Private nonprofit. Private colleges commonly report one tuition rate rather than separate resident and nonresident rates. In this dataset, Stanford University reports $62,484 for out-of-state tuition and $62,484 for in-state tuition. International student billing, visa expenses, health insurance and aid eligibility should be verified directly with the school.
Room and Board / Total Attendance Cost
Separate mandatory fee data is not available in the College Scorecard-derived table; use tuition, room/board, books, other expenses and attendance cost as the supported cost components.
Room and board, on campus
$19,922
Housing and meal estimate where reported.
Room and board, off campus
Not available
Off-campus living estimate where reported.
Books and supplies
$825
Academic supply estimate.
Other expenses, on campus
$4,602
Personal and miscellaneous estimate.
Total attendance cost
$82,162
Use as the sticker-price baseline before aid.
Average Net Price After Aid
Based on available data, the average student at Stanford University pays approximately $12,136 per year after grants and aid. This is below the California average of $19,695 and below the national average of $17,506.
Acceptance Rate and Outcomes
Acceptance Rate
3.91%
SAT Average
1,553
ACT Range
34-35
Stanford University Acceptance Rate Trend
The current College Scorecard value in this College Scorecard is 3.91%. This means approximately 39 applicants were admitted per 1,000 who applied, based on the College Scorecard enrollment of 7,841 undergraduates. Historical year-by-year acceptance rate data will appear here after multi-year College Scorecard releases are imported.
Current dataset
3.91%
Current College Scorecard admissions snapshot
Multi-year acceptance trend data is not shown until verified historical releases are imported. This avoids presenting decorative bars as real admissions history.
Tuition and Cost Breakdown
Accreditation
Western Association of Schools and Colleges Senior Colleges and University Commission
Institutional accreditor where reported.
In-state tuition
$62,484
National avg: $20,567
Out-of-state tuition
$62,484
National avg: $20,567
Attendance cost
$82,162
Use with aid and net price.
Average net price
$12,136
State avg: $19,695. National avg: $17,506.
Pell grant rate
19.23%
Federal need-based grant indicator.
Federal loan rate
6.29%
Share using federal loans.
What Does Stanford University Cost?
Total cost of attendance vs average net price after grants and aid, based on the College Scorecard data.
Tuition
$62,484
Room and board
$19,922
Books and supplies
$825
Other expenses
$4,602
Sticker price
$82,162
Average net price
$12,136
Average aid coverage
85%
$70,026 below sticker price on average

What You Pay
Based on available data, the average student at Stanford University pays approximately $12,136 per year after grants and aid. This is below the California average of $19,695 and below the national average of $17,506.
How Affordable Is Stanford University?
Average net price after grants and scholarships, compared to California and national averages.
Stanford University net price
$12,136
California average
$19,695
National average
$17,506
Stanford University Tuition and Net Price Trend
The current College Scorecard and IPEDS-derived source fields show tuition at $62,484 and average net price at $12,136. A multi-year trend chart will appear here after historical College Scorecard release tables are imported.
Current tuition
$62,484
Current net price
$12,136
Current-year comparison is shown now; historical bars will replace this fallback once multi-year College Scorecard releases are imported.
Student Outcomes
Completion Rate (150% Time)
92.82%
Full-time, first-time students completing within 150% of normal time.
10-Year Earnings
$124,080
Undergraduates
7,841
10-Year Median Earnings - Stanford University vs Peers
Median earnings 10 years after enrollment. Source: College Scorecard federal dataset.
Stanford University graduates earn about 2.8x the national average 10 years after enrollment, based on schools with reported earnings data.

Who Attends Stanford University?
Undergraduates
7,841
Completion rate
92.82%
Above national average; national avg: 52.02%
Pell recipients
19.23%
Below national average; national avg: 42.32%
Federal loan rate
6.29%
Below national average; national avg: 40.83%
Completion vs national average
Pell grant recipients
Federal loan usage
Financial Aid and Scholarships
About 19.23% of Stanford University students receive federal Pell grants, indicating the share of students receiving this need-based aid per College Scorecard. 6.29% take federal loans, which helps families understand borrowing patterns alongside net price.
Pell grant rate
19.23%
Federal loan rate
6.29%
Students with any loan
44.98%
Average net price
$12,136
Net Price by Income Bracket
Estimate Your Net Price at Stanford University
Select a family income bracket to see the average net price students in that range paid. Data comes from College Scorecard income-bracket averages when available.
Estimated net price for :
This estimate is based on College Scorecard averages for students in this income range who received federal aid. Actual amounts vary. Use Stanford University's official Net Price Calculator for a personalized figure.
Student Debt and Borrowing
Borrowing metrics help explain how students finance the gap between sticker price, aid and net price. Loans can make a bill payable, but they do not reduce the underlying cost like grants and scholarships.
Loan principal
$9,851
Median completer debt
$12,000
Median monthly payment
$127
Federal loan rate
6.29%
Debt and payment fields come from federal aid data where reported. Actual borrowing can vary by degree level, dependency status, aid package, family contribution and program costs.
Net Price Calculator
Use the official net price calculator for a personalized estimate. The averages on this page help with comparison, but your final price can change based on residency, aid eligibility, housing, program fees and scholarships.
Open Stanford University Net Price CalculatorFinancial Aid Application Steps
This guide keeps the steps generic and accurate for College Scorecard and IPEDS data, then points readers to official school and federal resources.
-
1. Complete the FAFSA when eligible
Use the federal FAFSA form to start federal student aid eligibility. Some private or selective schools may require additional institutional forms.
Open resource -
2. Check school-specific aid requirements
Open Stanford University's official financial aid or admissions site to confirm whether CSS Profile, tax documents or institutional forms are required.
Open resource -
3. Use the net price calculator
Compare the personalized estimate with the average net price and income-bracket values shown on this page.
Open resource -
4. Review grants, loans and payment deadlines
Separate grant aid from loan financing and verify billing deadlines directly with the school before committing.
Payment Guide
Use these generic steps to review tuition, aid and billing before making an enrollment decision.
-
1. Confirm published tuition and fees
Review Stanford University's official tuition page and compare it with the tuition and attendance cost fields on this page.
-
2. Estimate net price after aid
Use Stanford University's official net price calculator when available, then compare the estimate with average net price and income-bracket data.
-
3. Review financial aid and payment options
Check grants, scholarships, federal loans, payment plans and billing deadlines directly with the school before making enrollment decisions.
Stanford University Financial Health and Student Support Capacity
These institutional context fields help explain financial capacity beyond student-facing tuition. They are not a bill, but they add useful background for affordability, aid and student support research.
Endowment
$36,494,893,000
Endowment per undergraduate
$4,654,367
Faculty salary field
$24,226
Tuition revenue per FTE
$29,280
Instructional spend per FTE
$140,522
These fields come from federal institutional data and should be read as context, not as student charges. Endowment capacity can help explain how a school may support aid, instruction and long-term affordability for qualifying students.
Accreditation
Stanford University lists Western Association of Schools and Colleges Senior Colleges and University Commission as its accreditor per College Scorecard. Institutional accreditation is an important trust signal and can affect federal financial aid eligibility. Accreditation means an external agency has reviewed academic quality and institutional standards, which helps families verify whether federal aid pathways such as Pell grants and federal loans may apply.
Campus Location and Contact
Stanford University is listed at , Stanford, CA 94305. Accreditor: Western Association of Schools and Colleges Senior Colleges and University Commission.
Address
Stanford, CA 94305
Official website
Open school websiteAdmissions policy
Selective admissions policy reported
Compare Schools
Compare Stanford University with nationally comparable peer institutions across acceptance rate, tuition, net price and 10-year earnings. Click any school name to open its full profile.
- Accept. rate
- 3.91%
- Tuition
- $62,484
- Net price
- $12,136
- 10-yr earnings
- $124,080
- Accept. rate
- Not available
- Tuition
- Not available
- Net price
- Not available
- 10-yr earnings
- $143,238
- Accept. rate
- 13.06%
- Tuition
- $66,255
- Net price
- $32,492
- 10-yr earnings
- $138,687
- Accept. rate
- 3.14%
- Tuition
- $63,255
- Net price
- $18,902
- 10-yr earnings
- $128,566
- Accept. rate
- Not available
- Tuition
- Not available
- Net price
- Not available
- 10-yr earnings
- $115,318
Frequently Asked Questions
How much is Stanford University Tuition?
Stanford University out-of-state tuition per College Scorecard is $62,484. In-state tuition is $62,484. Verify current tuition directly with the school before making enrollment decisions.
What is Stanford University's average net price?
Stanford University's average net price per College Scorecard is $12,136. Net price reflects average cost after grants and scholarships where reported.
Does this page include all Stanford University fees?
The College Scorecard supports tuition, room and board, books, other expenses, attendance cost, net price and aid fields. Separate mandatory fee data is not available for every school, so fees should be verified with Stanford University.
What is Stanford University's acceptance rate?
Stanford University's acceptance rate per College Scorecard is 3.91%.
What does Stanford University cost for families earning under $30,000?
College Scorecard income-bracket data shows an average net price of $-79 for Stanford University students from families earning under $30,000. Actual costs vary; use the official net price calculator for a personalized estimate.
What is Stanford University's average earnings 10 years after enrollment?
Per College Scorecard, 10-year median earnings of $124,080 for Stanford University.
Is Stanford University accredited?
Stanford University's accreditor per College Scorecard is Western Association of Schools and Colleges Senior Colleges and University Commission.
How many students attend Stanford University?
Per College Scorecard, 7,841 undergraduate students at Stanford University.
What percentage of Stanford University students receive Pell grants?
The Pell grant rate for Stanford University per College Scorecard is 19.23%.
What is the federal loan rate at Stanford University?
The federal loan rate for Stanford University per College Scorecard is 6.29%.
Where should I verify Stanford University data?
Use this page for comparison, then verify admissions, tuition, net price and student outcomes directly with Stanford University or the latest official federal education data.
What SAT requirements does Stanford University report?
Stanford University reports SAT data around 1,553, with math 770-800 and reading 740-780 where available.
What GPA requirements does Stanford University have?
GPA requirements are not reported in the College Scorecard and IPEDS data. Use the acceptance rate, SAT/ACT ranges and admissions policy here as context, then verify GPA expectations with the official admissions office.
When is the Stanford University application deadline?
Application deadline data is not reported in the College Scorecard/IPEDS fields used here. Check the official admissions site for Early Action, Regular Decision, priority scholarship and transfer deadline dates.
What majors and best programs does Stanford University offer?
Stanford University has reported program records including Management Sciences and Quantitative Methods, Computer Science, Computer Science. Verify current majors with the official catalog.
What is Stanford University's ROI?
A simple ROI payback estimate is about 0.4 years using average net price and 10-year median earnings per College Scorecard.
Data Used on This Page
- Tuition and net price: U.S. Department of Education College Scorecard/IPEDS-derived data.
- Admissions and test signals: Reported federal fields where available.
- Official verification: School website and net price calculator where available.